

5.4 Hydrogen Chloride Emission Estimates
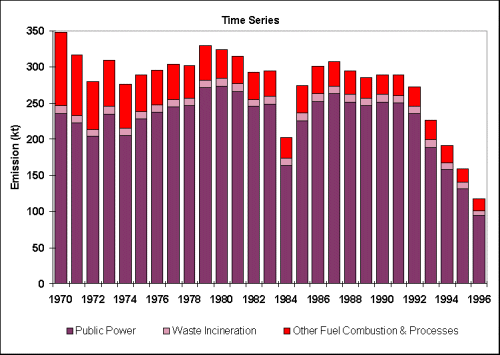
Table 5.5 and Figure 5.8 summarise the UK emissions of hydrogen chloride. Emissions have fallen by 60% since 1970. The main source of these emissions is coal combustion so the fall is a result of the decline in coal use and also the installation of flue gas desulphurisation at Drax and Ratcliffe since 1993. The other significant source of hydrogen chloride is waste incineration. Here the commissioning of new incinerators and the closure or upgrading of old plant has resulted in a significant fall in emissions in 1996.
| 1970 | 1975 | 1980 | 1985 | 1990 | 1993 | 1994 | 1995 | 1996 | ||
| By UNECE Category | ||||||||||
| Comb. in Energy Prod. & Transf. | ||||||||||
| Public Power | 235.84 | 227.86 | 273.49 | 225.81 | 252.08 | 188.90 | 157.51 | 131.52 | 94.76 | |
| Public Power (waste) | 0.00 | 0.00 | 0.00 | 0.00 | 1.82 | 2.88 | 4.74 | 3.12 | 3.27 | |
| Petroleum Refining Plants | 0.04 | 0.03 | 0.04 | 0.02 | 0.02 | 0.02 | 0.03 | 0.02 | 0.02 | |
| Other Comb. & Trans. | 4.54 | 2.82 | 1.56 | 0.78 | 0.27 | 0.11 | 0.05 | 0.02 | 0.02 | |
| Comb. in Comm., Inst., Resid. & Agri | ||||||||||
| Residential Plant | 47.34 | 27.27 | 21.02 | 20.29 | 9.96 | 10.90 | 9.17 | 6.32 | 6.36 | |
| Comm., Public & Agri. Comb | 9.85 | 4.64 | 4.27 | 4.03 | 2.86 | 1.95 | 1.71 | 1.24 | 1.36 | |
| Combustion in Industry | ||||||||||
| Iron & Steel Combustion | 2.00 | 0.75 | 0.44 | 0.17 | 0.15 | 0.12 | 0.12 | 0.25 | 0.38 | |
| Other Comb. in Industry | 37.25 | 14.93 | 11.98 | 11.84 | 12.11 | 13.27 | 11.37 | 9.82 | 7.42 | |
| Glass Production | 0.16 | 0.17 | 0.18 | 0.16 | 0.19 | 0.17 | 0.18 | 0.17 | 0.17 | |
| Processes in Industry | 0.09 | 0.09 | 0.09 | 0.09 | 0.09 | 0.09 | 0.09 | 0.09 | 0.09 | |
| Road Transport | 0.35 | 0.41 | 0.42 | 0.37 | 0.12 | 0.09 | 0.07 | 0.06 | 0.05 | |
| Other Mobile Sources & Machinery | 0.01 | 0.01 | 0.01 | 0.01 | 0.00 | 0.00 | 0.00 | 0.00 | 0.00 | |
| Waste Incineration | 10.57 | 10.58 | 10.58 | 10.58 | 8.77 | 7.71 | 5.85 | 5.76 | 3.24 | |
| Total | 348.04 | 289.56 | 324.08 | 274.16 | 288.44 | 226.22 | 190.88 | 158.40 | 117.14 | |

Interest in NMVOC emissions has grown as their role in the photochemical production of ozone has been appreciated. The diversity of processes which emit NMVOCs is huge, covering not only many branches of industry, but also transport, agriculture and domestic sources.
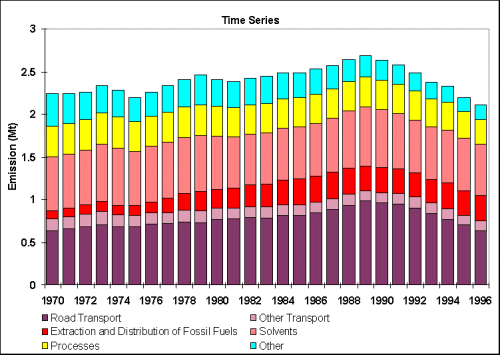
The NMVOC inventory is summarised in Table 5.5. Unlike SO2 and NOx , only about 33% of the UK estimate of NMVOC emissions come from combustion sources of which the majority arise from the transport sector. Other major sources of NMVOC emissions are the use of solvents and production processes. The NMVOC emission profile, Figure 5.9, shows a small overall increase in emissions between 1970 and 1989 with minor peaks in 1973 and 1979, followed by a steady reduction in emissions during the 1990s. The latter reflects the increasingly stringent emission limits.
| 1970 | 1975 | 1980 | 1985 | 1990 | 1993 | 1994 | 1995 | 1996 | 1996% | |
| By UNECE Source | ||||||||||
| Comb. in Energy Prod & Transf. | 7 | 6 | 6 | 7 | 7 | 8 | 9 | 7 | 8 | 0% |
| Comb. in Comm/Inst/Resid/Agri | ||||||||||
| Domestic | 228 | 130 | 100 | 91 | 50 | 47 | 37 | 29 | 31 | 1% |
| Other | 5 | 3 | 3 | 3 | 2 | 2 | 2 | 2 | 2 | 0% |
| Combustion in Industry | 18 | 12 | 9 | 8 | 9 | 8 | 8 | 8 | 8 | 0% |
| Production Processes | 359 | 355 | 351 | 339 | 348 | 325 | 326 | 311 | 285 | 13% |
| Extr./Distrib. of Fossil Fuels | ||||||||||
| Petrol Marketing | 82 | 93 | 109 | 116 | 130 | 123 | 118 | 113 | 114 | 5% |
| Gas Leakage | 2 | 13 | 17 | 19 | 19 | 18 | 18 | 18 | 17 | 1% |
| Offshore | 4 | 7 | 97 | 164 | 140 | 138 | 166 | 154 | 162 | 8% |
| Solvent Use | 634 | 634 | 617 | 617 | 680 | 619 | 620 | 616 | 604 | 29% |
| Road Transport | ||||||||||
| Combustion - petrol | 451 | 479 | 542 | 582 | 690 | 599 | 553 | 505 | 453 | 22% |
| Combustion - DERV | 104 | 109 | 117 | 116 | 130 | 114 | 109 | 98 | 90 | 4% |
| Evaporation | 81 | 92 | 110 | 118 | 141 | 126 | 111 | 98 | 91 | 4% |
| Other Transp & Mach. | ||||||||||
| Off-Road | 118 | 114 | 109 | 104 | 99 | 100 | 99 | 96 | 97 | 5% |
| Other | 24 | 24 | 24 | 23 | 23 | 23 | 22 | 22 | 22 | 1% |
| Waste Treatment & Disp. | 18 | 20 | 64 | 48 | 49 | 45 | 52 | 44 | 46 | 2% |
| Agricult/Forest/Land Use Change | 27 | 27 | 48 | 54 | 35 | 0 | 0 | 0 | 0 | 0% |
| Nature | 80 | 80 | 80 | 80 | 80 | 80 | 80 | 80 | 80 | 4% |
| By Fuel | ||||||||||
| Solid | 242 | 132 | 99 | 89 | 47 | 42 | 32 | 23 | 23 | 1% |
| Petroleum | 703 | 731 | 796 | 828 | 945 | 838 | 786 | 724 | 667 | 32% |
| Gas | 6 | 9 | 11 | 13 | 13 | 15 | 16 | 15 | 17 | 1% |
| Non-fuel | 1292 | 1325 | 1497 | 1559 | 1627 | 1480 | 1497 | 1438 | 1404 | 67% |
| Total | 2243 | 2197 | 2403 | 2489 | 2632 | 2375 | 2331 | 2200 | 2111 | 100% |

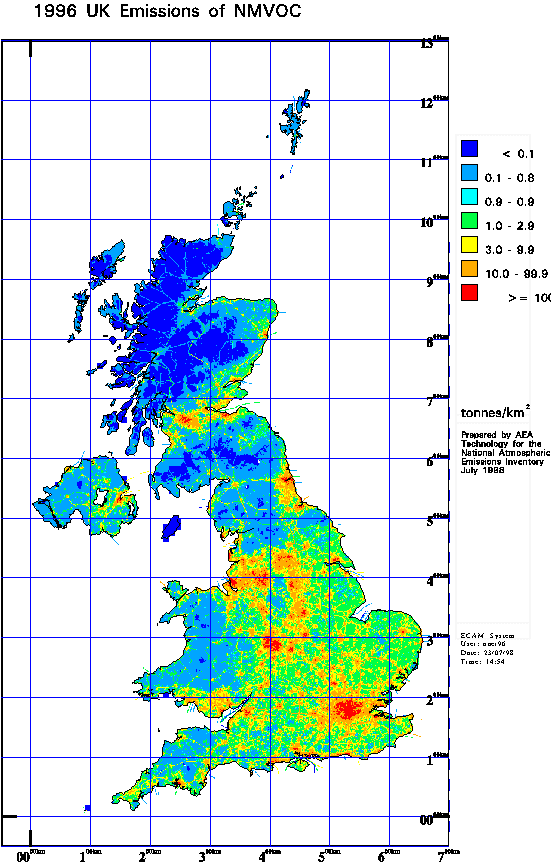
The spatial disaggregation of NMVOC emissions in the UK is shown in Figure 5.10. As a large proportion of solvent use is dependent on population and solvent use is a significant fraction of the UK total emissions, the map is heavily influenced by the population distribution. Unlike the maps presented previously for SO2 and NOx, the VOC map has little major road definition except where the major roads go through rural areas. This reflects the fact that NMVOC emissions are dependent on vehicle speed and are higher on minor and urban major roads than on the high speed motorways and major roads. The maps also indicate the refineries as major point sources.

Solvent use and production processes are responsible for 29% and 13%, respectively, of the 1996 emission. These estimates are based on a combination of solvent consumption data and industrial production data. Although NMVOC estimates are being continuously improved (Appendix 2), they remain fairly uncertain and little trend is apparent although since 1990 there is a steady reduction reflecting the stricter emission controls.
5.5.2 Transport
Total transport emissions are currently responsible for 36% of NMVOC emissions of which 30% are a result of road transport. The emission rose gradually with increasing car numbers to a peak in 1989. Since then it has declined by 36% owing to the increased use of catalytic converters and fuel switching from petrol to diesel cars; it is currently at approximately the same level as in 1970.
5.5.3 Other Sectors
Offshore oil and gas emissions have increased substantially since 1970 with the growth of the UK's offshore industry and now constitute 8% of the total. The most important sources of NMVOC emissions are tanker loading, venting and fugitives.
Emissions from gas leakage currently comprise around 1% of the total NMVOC emission. This source is declining as a result of the gas main replacement programme underway since 1990. The evaporative losses from distribution and marketing petrol rose between 1970 and the early 1990s reflecting the growth in road transport but more recently have remained relatively constant, probably as a result of recent fuel switching to diesel. They currently account for around 4% of national NMVOC emissions.
The contribution from domestic heating has fallen by a factor of 7 over the period 1970-1996 as the use of coal for domestic heating has declined. It now accounts for just 1% of the UK emission.
NMVOC emissions from waste treatment and disposal contribute 2% to national emissions. New data from the Environment Agency (1997) shows emissions from municipal waste incinerators to be insignificant.
5.5.4 Speciation of NMVOCs
As mentioned previously, the term NMVOC covers a wide range of compounds and although a total NMVOC inventory is sufficient for some purposes, in other cases greater detail is required concerning the nature and concentration of individual compounds. For example, when assessing the photochemical production of ozone, individual species have different ozone forming potentials hence information is required on the concentration of individual species (QUARG, 1993). Table 5.6 shows the 1996 NMVOC emission disaggregated as far as possible by source and species.
