Emissions of 1,3 butadiene arise from the combustion of petroleum products and its manufacture and use in the chemical industry. 1,3-Butadiene is not present in petrol and is formed as a by-product of combustion- hence it is not present in road transport evaporative emissions. The road transport sector dominates the UK emissions in 1998, contributing 88% of the total. Emissions of 1,3-butadiene for 1990 to 1998 are given in Table 4.11 and Figure 4.10 below
As with benzene, the introduction of catalytic converters in 1991 has had a significant impact on the emissions from the road transport sector- causing a reduction of 48% from 1990 to 1998. Emissions from other significant combustion sources, such as other transportation and machinery, have not significantly decreased.
1,3-Butadiene emissions also arise as stack and more importantly, fugitive emissions from its manufacture and extensive use in the chemical industry. 1,3- Butadiene is used in the production of various forms of synthetic rubber. There is little information on emissions from the chemical industry, and data which is available does not often include enough information to generate a representative time series. As a result the emission estimates are high in uncertainty. Reported emission estimates for the chemical industry sectors (Environment Agency, 1999) have been incorporated into the inventory.
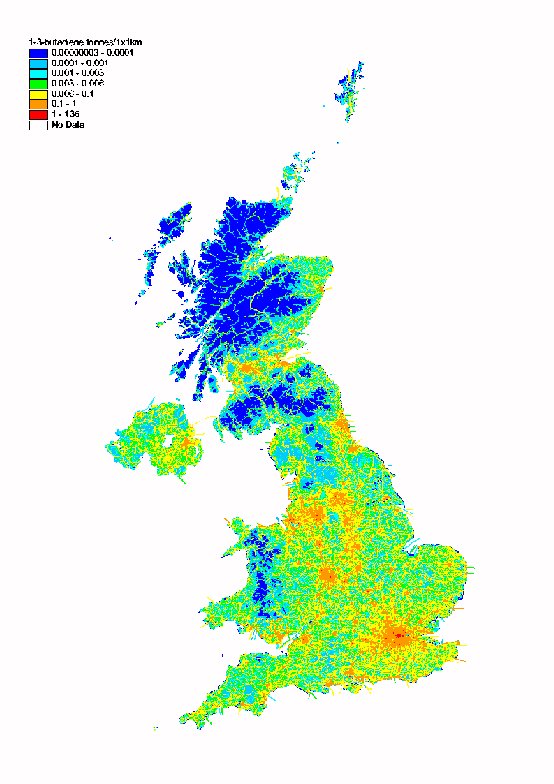
Spatially disaggregated emissions of 1,3-butadiene are shown in Figure 4.11. Emissions of 1,3-butadiene arise almost exclusively from road transport activities, and an interesting comparison may be drawn with the UK emissions map for benzene (Figure 4.9), where other sources make a significant contribution to the total emissions. As with benzene, 1,3-butadiene emissions per km from road transport decrease with increasing speed. Consequently the emissions density is high in urban areas, and the major roads (such as motorways) are not particularly highlighted.
Benzene and 1,3-butadiene emission maps (Figures 4.9 and 4.11) may be contrasted with mapped NOx emissions (Figure 5.2)- NOx emissions from road transport activities increasing with increasing vehicle speed.
Table 4.11 UK Emissions of 1,3-butadiene 1990 – 1998 (ktonnes)
|
1990 |
1991 |
1992 |
1993 |
1994 |
1995 |
1996 |
1997 |
1998 |
1998% |
|
|
BY UN/ECE CATEGORY1 |
||||||||||
|
Comb. in Energy Prod. |
0.00 |
0.00 |
0.00 |
0.00 |
0.00 |
0.00 |
0.00 |
0.00 |
0.00 |
0% |
|
Comb. in Comm/Inst/Res |
0.00 |
0.00 |
0.00 |
0.00 |
0.00 |
0.00 |
0.00 |
0.00 |
0.00 |
0% |
|
Combustion in Industry |
0.01 |
0.01 |
0.01 |
0.01 |
0.01 |
0.01 |
0.01 |
0.01 |
0.01 |
0% |
|
Production Processes |
0.36 |
0.33 |
0.33 |
0.32 |
0.28 |
0.29 |
0.28 |
0.27 |
0.27 |
4% |
|
Extr./Distrib. of Fossil Fuels |
0.15 |
0.13 |
0.12 |
0.10 |
0.09 |
0.08 |
0.07 |
0.06 |
0.05 |
1% |
|
Road Transport |
11.83 |
11.88 |
11.41 |
10.64 |
9.87 |
8.99 |
7.96 |
6.99 |
6.13 |
88% |
|
Other Trans/Mach |
||||||||||
|
Off Road Trans/Machinery |
0.33 |
0.36 |
0.38 |
0.37 |
0.36 |
0.35 |
0.35 |
0.34 |
0.34 |
5% |
|
Other Transport |
0.09 |
0.09 |
0.10 |
0.10 |
0.10 |
0.11 |
0.11 |
0.12 |
0.12 |
2% |
|
Waste |
0.02 |
0.02 |
0.02 |
0.02 |
0.02 |
0.01 |
0.01 |
0.01 |
0.01 |
0% |
|
TOTAL |
12.78 |
12.82 |
12.36 |
11.55 |
10.73 |
9.84 |
8.80 |
7.80 |
6.93 |
100% |
1 See Appendix 4 for definition of UN/ECE Categories
Figure 4.10 Time Series of 1,3-Butadiene Emissions
Figure 4.11 Spatially Disaggregated UK Emissions of 1,3-Butadiene