

The most recent inventory of the UK emissions of ammonia is shown in Table 5.11. The inventory is based on a working group on ammonia emissions comprising DETR, MAFF, Silsoe Research Institute, Institute of Grassland and Environmental Research, Imperial College, The Defence Establishment Research Association, Centre for Ecology and Hydrogeology and AEA Technology. Much work has been done over recent years to improve the estimates from both agricultural and non-agricultural sources.
Table 5.11 UK Emissions of Ammonia (ktonnes)
|
1970 |
1980 |
1990 |
1991 |
1992 |
1993 |
1994 |
1995 |
1996 |
1997 |
1998 |
1998% |
|
|
BY UN/ECE CATEGORY1 |
||||||||||||
|
Comb. in Energy Prod. |
||||||||||||
|
Public Power |
0 |
0 |
0 |
0 |
0 |
0 |
0 |
0 |
0 |
0% |
||
|
Other Comb. & Trans. |
0 |
0 |
0 |
0 |
0 |
0 |
0 |
0 |
0 |
0% |
||
|
Comb. in Comm/Inst/Res |
||||||||||||
|
Residential Plant |
5 |
5 |
4 |
5 |
4 |
3 |
3 |
3 |
2 |
1% |
||
|
Comm/Pub/Agri Comb |
0 |
0 |
0 |
0 |
0 |
0 |
0 |
0 |
0 |
0% |
||
|
Combustion in Industry |
||||||||||||
|
Iron & Steel Comb. |
0 |
0 |
0 |
0 |
0 |
0 |
0 |
0 |
0 |
0% |
||
|
Other Ind. Comb. |
0 |
0 |
0 |
0 |
0 |
0 |
0 |
0 |
0 |
0% |
||
|
Production Processes |
||||||||||||
|
Processes in Industry |
10 |
10 |
10 |
10 |
10 |
10 |
10 |
10 |
10 |
3% |
||
|
Other Processes |
1 |
1 |
1 |
1 |
1 |
1 |
1 |
1 |
1 |
0% |
||
|
Solvent Use |
1 |
1 |
1 |
1 |
1 |
1 |
1 |
1 |
1 |
0% |
||
|
Road Transport |
1 |
1 |
2 |
4 |
6 |
9 |
12 |
14 |
17 |
5% |
||
|
Waste |
||||||||||||
|
Landfill |
4 |
4 |
4 |
4 |
4 |
4 |
4 |
4 |
4 |
1% |
||
|
Non Landfill Waste |
19 |
19 |
19 |
19 |
19 |
19 |
19 |
19 |
19 |
6% |
||
|
Agriculture |
||||||||||||
|
Animal Wastes |
266 |
256 |
253 |
255 |
257 |
253 |
252 |
254 |
259 |
74% |
||
|
Non Livestock Agricul. |
52 |
56 |
43 |
39 |
37 |
32 |
26 |
30 |
29 |
8% |
||
|
Other |
6 |
6 |
6 |
6 |
6 |
6 |
6 |
6 |
6 |
2% |
||
|
By FUEL TYPE |
||||||||||||
|
Solid |
5 |
5 |
5 |
5 |
4 |
3 |
3 |
3 |
2 |
1% |
||
|
Petroleum |
1 |
1 |
2 |
4 |
6 |
9 |
12 |
14 |
17 |
5% |
||
|
Gas |
0% |
|||||||||||
|
Non-Fuel |
360 |
354 |
338 |
336 |
337 |
327 |
321 |
327 |
331 |
94% |
||
|
TOTAL |
366 |
360 |
345 |
345 |
347 |
339 |
335 |
344 |
350 |
100% |
1 See Appendix 4 for definition of UN/ECE Categories
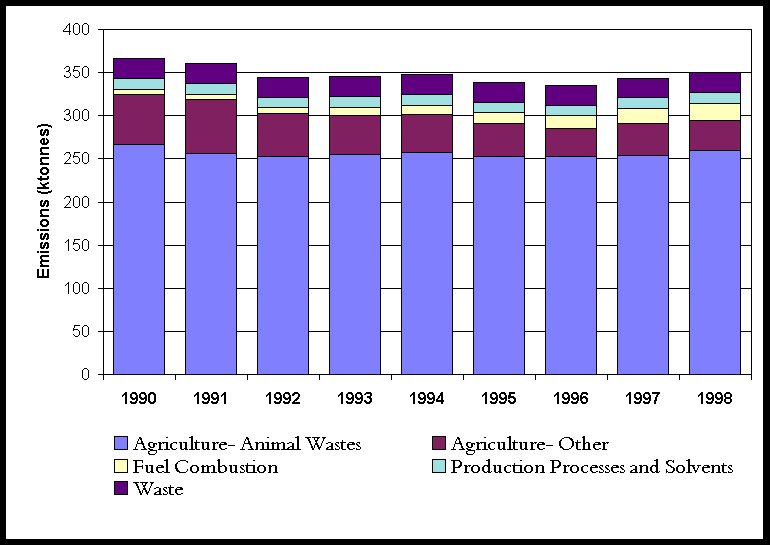
Ammonia emissions are dominated by agricultural sources with emissions from livestock and their wastes comprising 74% of the total emission. These emissions derive mainly from the decomposition of urea in animal wastes and uric acid in poultry wastes. Emissions depend on animal species, age, weight, diet, housing systems, waste management and storage techniques . Hence emissions are affected by a large number of factors which make the interpretation of experimental data difficult and emission estimates uncertain (DOE, 1994). The other agricultural sources included are emissions from fertiliser use, crops and decomposition of agricultural vegetation. These are particularly uncertain owing to the complexity of the processes involved.
Sutton et al (1999) give estimates a of a number of non-agricultural emission estimates which have been incorporated here. The non agricultural sources comprise a number of diverse sources and equal 16% of the total, however emission estimates for these sources are very uncertain due to a lack of data. Emissions of ammonia from road transport although relatively small are increasing as a result of the increasing number of three way catalysts in the vehicle fleet.
Figure 5.17 UN/ECE Emissions of Ammonia (ktonnes)
NON UN/ECE NH3 Emission Estimates
It should be noted that there are a number of NH3 sources which are not included in the data presented above. This is because sources of NH3 exist which are not covered by the UN/ECE reporting format. There is however interest in estimating the total NH3 emissions for a number of purposes, and consequently a summary of the emission estimates from sources not included in Table 5.11 above are included below.
Table 5.12 Emission Estimates from Sources not covered by UN/ECE (ktonnes)
|
1990 |
1991 |
1992 |
1993 |
1994 |
1995 |
1996 |
1997 |
1998 |
|
|
Adult Breath & Sweat |
1.19 |
1.19 |
1.20 |
1.20 |
1.21 |
1.21 |
1.21 |
1.22 |
1.22 |
|
Cigarette Smoking |
0.24 |
0.24 |
0.24 |
0.24 |
0.24 |
0.24 |
0.24 |
0.24 |
0.24 |
|
Infant Emissions (Nappies) |
0.04 |
0.04 |
0.04 |
0.04 |
0.04 |
0.04 |
0.04 |
0.04 |
0.04 |
|
Animal Wastes- Wild Birds |
4.25 |
4.25 |
4.25 |
4.25 |
4.25 |
4.25 |
4.25 |
4.25 |
4.25 |
|
Animal Wastes- Wild Other |
2.18 |
2.18 |
2.18 |
2.18 |
2.18 |
2.18 |
2.18 |
2.18 |
2.19 |
|
TOTAL |
7.90 |
7.90 |
7.91 |
7.91 |
7.91 |
7.92 |
7.92 |
7.93 |
7.93 |
NH3 is emitted from humans via a number of activities- the most significant being breath and sweat. The smoking of cigarettes emits high levels of NH3, but makes a considerably smaller contribution to the total emission. Emissions from nappies is small by comparison. The emissions of NH3 arising from animal wastes (from wild birds and other wild animals) comprise the largest contributions to the total of these non UN/ECE sources.
As can be seen from Table 5.12 the emissions from these non UN/ECE sources do not vary greatly with time and, although significant, do not constitute a particularly large fraction of the total UK NH3 emission. The uncertainty associated with each of these emission estimates is high. The data here has been quoted to two decimal places, simply to allow comparisons to be made between the source sectors.