Figure 5.1 Emission Profile NOx Emissions
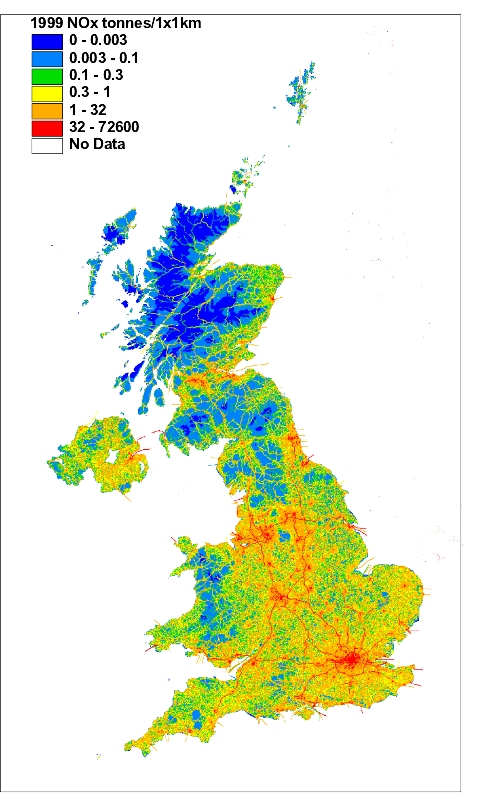
Figure 5.2 Spatially Disaggregated UK Emissions of NOx

Since 1970 there has been a reduction in total NOx emissions of 36%, however this decrease in emissions has not been constant (Figure 5.1). Up to 1984 the NOx emission profile was relatively flat with small peaks in 1973 and 1979, as seen previously for CO2, which were due largely to the cold winters in those years. However, from 1984, emissions rose markedly as a result of the growth in road traffic reaching a peak in 1989 (Table 5.3). Since 1989, total emissions have declined by 43% as a result of a 56% reduction from power stations and 46% decrease from road transport.
The spatially disaggregated emission inventory for the UK based on a 1x1 km grid is shown in Figure 5.2 and data files are also available from the NAEI’s internet site http://www.aeat.co.uk/netcen/airqual/naei/index.html. A large fraction (the order of 30%) of the total emission is concentrated in a few grid squares which contain point sources. For NOx road transport dominates with approximately one third of the UK NOx emission deriving from major sections of road. Vehicles travelling at high speeds contribute most. As a result the major route-ways (e.g. Motorways and primary routes) are clearly defined on the map. Conurbations and city centres show high emissions resulting from large volumes of road transport, residential and commercial combustion. A combination of high national shipping emission and relatively few large ports result in significant localised emissions from shipping in port areas.
Table 5.3 UK Emissions of Nitrogen Oxides by UN/ECE1 Source Category and Fuel (kt)
|
1970 |
1980 |
1990 |
1991 |
1992 |
1993 |
1994 |
1995 |
1996 |
1997 |
1998 |
1999 |
1999% |
|
|
BY UN/ECE CATEGORY2 |
|||||||||||||
|
Comb. in Energy Prod. |
|||||||||||||
|
Public Power |
812 |
861 |
781 |
683 |
671 |
568 |
527 |
495 |
449 |
372 |
365 |
338 |
21% |
|
Petroleum Refining Plants |
43 |
42 |
40 |
41 |
38 |
35 |
34 |
33 |
33 |
33 |
37 |
29 |
2% |
|
Other Comb. & Trans. |
62 |
45 |
63 |
65 |
65 |
67 |
77 |
50 |
48 |
48 |
52 |
55 |
3% |
|
Comb. in Comm/Inst/Res |
|||||||||||||
|
Residential Plant |
62 |
64 |
64 |
71 |
69 |
72 |
69 |
66 |
75 |
69 |
71 |
71 |
4% |
|
Comm/Pub/Agri Comb. |
74 |
46 |
37 |
40 |
39 |
38 |
38 |
37 |
39 |
35 |
34 |
32 |
2% |
|
Combustion in Industry |
|||||||||||||
|
Iron & Steel Comb. |
75 |
25 |
22 |
22 |
22 |
23 |
27 |
26 |
25 |
26 |
24 |
24 |
2% |
|
Other Ind. Comb. |
324 |
246 |
197 |
188 |
183 |
181 |
187 |
172 |
165 |
166 |
159 |
145 |
9% |
|
Production Processes |
16 |
15 |
13 |
11 |
10 |
10 |
9 |
6 |
6 |
6 |
6 |
6 |
0% |
|
Extr./Distrib. of Fossil Fuels |
0 |
0 |
1 |
1 |
1 |
0 |
1 |
1 |
1 |
1 |
1 |
1 |
0% |
|
Road Transport |
769 |
989 |
1306 |
1275 |
1225 |
1147 |
1084 |
997 |
956 |
880 |
786 |
714 |
44% |
|
Other Trans/Mach |
|||||||||||||
|
Off-Road Sources |
120 |
104 |
89 |
92 |
92 |
90 |
88 |
85 |
89 |
87 |
88 |
82 |
5% |
|
Other3 |
124 |
120 |
130 |
131 |
128 |
124 |
117 |
117 |
122 |
118 |
108 |
103 |
6% |
|
Waste |
6 |
12 |
9 |
9 |
8 |
8 |
9 |
9 |
8 |
4 |
4 |
3 |
0% |
|
Land Use Change |
10 |
15 |
9 |
8 |
6 |
0 |
0 |
0 |
0 |
0 |
0 |
0 |
0% |
|
By FUEL TYPE |
|||||||||||||
|
Solid |
877 |
864 |
770 |
687 |
670 |
547 |
499 |
469 |
414 |
339 |
326 |
298 |
19% |
|
Petroleum |
1389 |
1425 |
1661 |
1628 |
1566 |
1490 |
1407 |
1295 |
1260 |
1154 |
1048 |
951 |
59% |
|
Gas |
104 |
174 |
218 |
227 |
234 |
245 |
267 |
245 |
266 |
271 |
282 |
290 |
18% |
|
Non-Fuel |
128 |
122 |
112 |
95 |
87 |
82 |
92 |
84 |
77 |
82 |
79 |
65 |
4% |
|
TOTAL |
2497 |
2585 |
2761 |
2636 |
2557 |
2363 |
2265 |
2092 |
2017 |
1846 |
1735 |
1605 |
100% |
1 UK emissions reported in IPCC format (Salway, 2001) differ slightly due to the different source categories used.
2 See Appendix 4 for definition of UN/ECE Categories
3 Including railways, shipping, naval vessels, military aircraft
Figure 5.1 Emission Profile NOx Emissions
Figure 5.2 Spatially Disaggregated UK Emissions of NOx
The major source of NOx emissions in the UK is the transport sector with road vehicles and off-road vehicles contributing 44% and 5%, respectively, to the total emission. Road emissions rose steadily between 1970 and 1989 reflecting the overall growth in road traffic in the UK. During this period emissions from total petrol consumption, predominantly cars, rose by 102% compared to the 1970 level and emissions from DERV consumption rose by 40%. Figure 5.3 clearly shows the growth in the vehicle fleet and vehicle mileage during this period. Since 1989 there has been a steady decline in emissions due to the introduction of catalytic converters on cars and stricter regulations on truck emissions.
Figure 5.3 Emissions of NOx from Road Transport by Vehicle Type
Figure 5.4 shows the average NOx emissions per vehicle kilometre for different vehicle types (NOTE: two different Y scales are used). Various emission regulations on new petrol cars which have come into effect in stages since 1976 have led to the gradual reduction in emission rates from petrol cars. The more rapid decline in emissions from 1992 is due to the penetration of cars fitted with three-way catalysts. Limits on emissions from diesel cars and Light Goods Vehicles (LGVs) did not first come into effect until 1993/94. Overall emissions per kilometre from Heavy Goods Vehicles (HGVs) showed a small rise from 1970-1987 due to the increasing usage of larger HGVs for freight movement. Limits on emissions from HGVs first came into effect in 1988 leading to a gradual reduction in emission rates as new HGVs penetrated the fleet, accelerated by tighter limits on emissions from new HGVs in 1993/94.
Figures 5.4 NOx Emissions per Vehicle km by Vehicle Type
Figure 5.5 shows emissions per passenger km and by tonne km of freight. Technological improvements to HGVs give rise to approximately half the emissions per tonne of freight moved in 1998 compared with 1970. Emissions per passenger km from cars, vans and taxies have significantly decreased since 1970 due mainly to the introduction of the catalyst in 1992 now penetrating the car fleet. Per passenger km emissions from buses and coaches have increased from 1970 to 1993. This was due to the gradual decrease in occupancy rate of buses and their under utilisation over this period. Since 1993, this rise in per passenger km emissions has been halted by the penetration of buses meeting tighter emission standards into the fleet.
Figure 5.5 Emissions of NOx by Mode for Passenger and Freight Transport
Other transport and machinery contribute a further 11% to total UK NOx emissions. Of these only those from civil aircraft have grown steadily over the period 1970 to 1999 (take-off and landing cycles up to an altitude of 1000 m only are considered here in accordance with UN/ECE guidelines). However, these emissions contribute only a small percentage of the total emission.
Emissions from power stations have declined over the period 1970-1999 by 58%. Emissions in the seventies were fairly constant from year to year, with peaks in severe winters. Since 1979 emissions have declined with a significant decrease at the time of the miners strike in 1984. Prior to 1989 this decline was due to the increased use of nuclear power and an increase in the average efficiency of the thermal power stations. Since 1988 the electricity generators have adopted a programme of progressively fitting low NOx burners to their 500 MWe coal fired units. More recently the increased use of nuclear generation and the introduction of CCGT plant burning natural gas (See Section 2.2.2) have further reduced NOx emissions. The emissions from the low NOx turbines used are much lower than those of pulverised coal fired plant even when low NOx burners are fitted. Given that these trends continue, power station emissions are expected to fall further.
The emissions from industrial combustion have declined by 58% since 1970 and they currently contribute 11% to total UK emissions. This is due to the decline in coal use in favour of gas and electricity.