
SO2 Emission EStimates
Since 1970 there has been a substantial overall reduction of more than 80% in SO2 emissions (Figure 5.6). The emission profile exhibits a steady decline between 1970 and 1999 with the exception of small peaks in 1973 and 1979 corresponding to the harsh winters in those years and a short period at the end of the 1980s when emissions were relatively constant from year to year. It is also evident that there is little decrease between total SO2 emissions in 1997 and 1998. This occurs because the large reductions in emissions from the power generation sector are not as substantial between 1997 and 1998. However the trend resumes between 1998 and 1999.
Table 5.3 shows emissions broken down by fuel categories. The two main contributors are solid fuel and petroleum products. Emissions from solid fuel use have declined by 76% since 1970 and those from petroleum by 91%. The most important factors in the fall in emissions from petroleum use are the decline in fuel oil use and the reduction in the sulphur content of gas oil and DERV. The reduction in the sulphur content of gas oil is particularly significant in sectors such as domestic heating, commercial heating and off-road sources where gas oil is used extensively. The sulphur content of DERV has steadily reduced across recent years, giving rise to a significant reduction in SO2 emissions. SO2 emissions from DERV in the early 1990’s were relatively constant, however between 1994 and 1999 there has been a 95% reduction in emissions.
Figure 5.6 Emissions profile for SO2
Table 5.4 UK Emissions of Sulphur Dioxide by UN/ECE1 Source Category and Fuel (kt)
|
|
1970 |
1980 |
1990 |
1991 |
1992 |
1993 |
1994 |
1995 |
1996 |
1997 |
1998 |
1999 |
1999% |
|
BY UN/ECE CATEGORY2 |
|
|
|
|
|
|
|
|
|
|
|
|
|
|
Comb. in Energy Prod. |
|
|
|
|
|
|
|
|
|
|
|
|
|
|
Public Power |
2913 |
3007 |
2723 |
2535 |
2434 |
2083 |
1762 |
1591 |
1320 |
1025 |
1072 |
776 |
65% |
|
Petroleum Refining Plants |
242 |
262 |
153 |
161 |
146 |
148 |
135 |
142 |
144 |
134 |
98 |
93 |
8% |
|
Other Comb. & Trans. |
302 |
71 |
42 |
38 |
15 |
13 |
10 |
9 |
10 |
13 |
12 |
15 |
1% |
|
Comb. in Comm/Inst/Res |
|
|
|
|
|
|
|
|
|
|
|
|
|
|
Residential Plant |
522 |
226 |
108 |
115 |
103 |
113 |
92 |
67 |
71 |
63 |
53 |
53 |
4% |
|
Comm/Pub/Agri Comb. |
451 |
218 |
90 |
85 |
89 |
95 |
80 |
60 |
57 |
47 |
34 |
22 |
2% |
|
Combustion in Industry |
|
|
|
|
|
|
|
|
|
|
|
|
|
|
Iron & Steel Comb. |
433 |
128 |
88 |
86 |
66 |
75 |
70 |
65 |
58 |
58 |
45 |
42 |
4% |
|
Other Ind. Comb. |
1413 |
776 |
370 |
385 |
433 |
427 |
366 |
279 |
227 |
190 |
161 |
114 |
10% |
|
Production Processes |
94 |
77 |
48 |
42 |
36 |
33 |
30 |
27 |
27 |
25 |
19 |
17 |
1% |
|
Extr./Distrib. of Fossil Fuels |
5 |
5 |
16 |
6 |
7 |
5 |
6 |
6 |
7 |
6 |
6 |
1 |
0% |
|
Solvent Use |
2 |
2 |
2 |
2 |
2 |
2 |
2 |
5 |
4 |
5 |
5 |
4 |
0% |
|
Road Transport |
44 |
42 |
63 |
58 |
62 |
59 |
63 |
51 |
37 |
27 |
23 |
12 |
1% |
|
Other Trans/Mach3 |
93 |
61 |
47 |
51 |
49 |
48 |
47 |
44 |
45 |
42 |
38 |
35 |
3% |
|
Waste |
4 |
5 |
5 |
5 |
5 |
3 |
3 |
3 |
2 |
1 |
2 |
4 |
0% |
|
By FUEL TYPE |
|
|
|
|
|
|
|
|
|
|
|
|
|
|
Solid |
3673 |
3141 |
2770 |
2674 |
2575 |
2169 |
1843 |
1641 |
1358 |
1154 |
1181 |
873 |
74% |
|
Petroleum |
2546 |
1548 |
811 |
747 |
746 |
845 |
721 |
605 |
559 |
387 |
295 |
223 |
19% |
|
Gas |
192 |
94 |
84 |
77 |
59 |
30 |
30 |
29 |
31 |
37 |
30 |
33 |
3% |
|
Non-Fuel |
107 |
98 |
89 |
71 |
67 |
61 |
72 |
74 |
63 |
59 |
61 |
58 |
5% |
|
TOTAL |
6518 |
4880 |
3754 |
3568 |
3447 |
3105 |
2665 |
2348 |
2010 |
1637 |
1567 |
1187 |
100% |
1 UK emissions reported in IPCC format (Salway, 2001) differ slightly due to the different source categories used.
2 See Appendix 4 for definition of UN/ECE Categories
3 Including railways, shipping, naval vessels, military aircraft and off-road sources
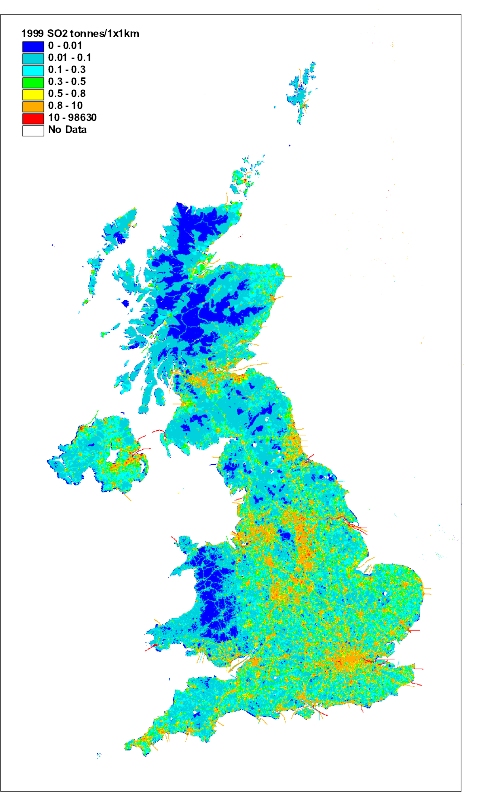
The geographical distribution of SO2 emissions is shown in Figure 5.7. A large fraction (the order of 80%) of the SO2 emissions are concentrated into relatively few 1x1 km grid squares containing the major point sources such as refineries and power stations and large industrial plant. The resulting map highlights the main conurbations and some major roads. High emissions in Plymouth and Newport result from a combination of shipping and industry. London and Birmingham, which are covered by Smoke Control Areas, show relatively low SO2 emission levels. High emission densities are noted in Belfast where there is substantial consumption of solid fuels in the domestic sector for heating etc.
Figure 5.7 Spatially Disaggregated UK Emissions of SO2
Power Generation
The largest contribution to SO2 emissions is from power stations which accounts for 65% of the total in 1999. Historically coal combustion has been the most important source- the sulphur content of the coal being directly proportional to the emission estimate. Since 1970 there has been a gradual decline in power station emissions of around 73%. This reflects the changes in fuel mix and the types of power plant which have taken place during the period. From 1970 to 1990 the reduction was due to a gradual increase in the use of nuclear plant and improvements in efficiency (See Section 2.2.2). Since 1990, this decline has accelerated because of the increase in the proportion of electricity generated in nuclear plant and the use of Combined Cycle Gas Turbine (CCGT) stations and other gas fired plant. CCGTs are more efficient than conventional coal and oil stations and have negligible SO2 emissions. It is expected that these reductions will continue in the near future as more CCGT stations are built. Most recently the flue gas desulphurisation plants, constructed at Drax and Ratcliffe power stations have had a significant effect on emissions.
Industry
Emissions of SO2 from industry result from the combustion of coal and oil, some refinery processes and the production of sulphuric acid. Between 1970 and 1999 industrial emissions from combustion sources have fallen by 92% though most of the fall took place between 1970-1985 reflecting the decline in the energy intensive iron and steel industry and other heavy industries. There has been also been a decline in the use of coal and oil in favour of natural gas.
Transport
Transport emissions account for just 1% of the total SO2 emissions. Between 1970 and the early 1990s, road transport emissions grew with the increase in road vehicles, however more recently emissions have declined with the reduction in the sulphur content of DERV. Similarly the reduction in sulphur content of gas oil is reflected in the emissions from off-road vehicles.
Other
Emissions from the remaining categories are low compared with those discussed above. Emissions from domestic and other commercial/institutional sectors have declined substantially during the period 1970-1999, reflecting the major changes in fuel mix from oil and coal to gas. The decrease in emissions from waste reflects the closure of a number of old incinerators due to the introduction of new emission standards and their replacement with modern equipment.