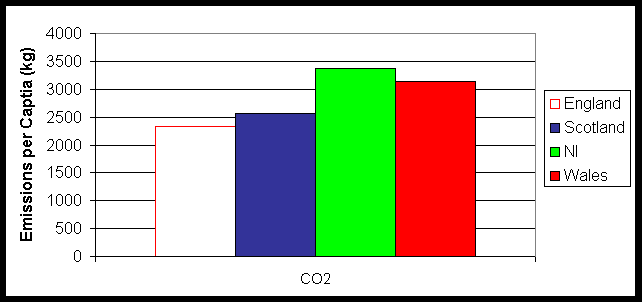
Figure 8.1 Regional Emissions of CO2 per Capita

The UK emission maps presented throughout this report give emission on a 1 km x 1 km grid basis. It is therefore possible to use these maps to calculate emission totals for the different UK Regions. The following plots give the emissions per capita for each of the regions. The text considers the data in more detail and comments on the emissions from individual sectors in each Region, and how these vary between the Regions.
Data is presented to several significant figures in this report, but this should not be taken as an indication of the uncertainties associated with the data. In calculating the emissions by Region, a number of approximations must be made, giving rise to not inconsiderable uncertainties in the resulting emissions totals. Pollutants which are dominated by emissions from point sources are expected to be more accurate than those dominated by area sources as the mapping of the point sources will be more reliable.
The primary sources of CO2 in the UK are stationary combustion sources and road transport. For England, Scotland and Northern Ireland, large point sources account for approximately 45% of the total CO2 emission for the respective regions. The impact of a relatively large number of point sources in Wales gives rise to a 65% contribution to the total CO2 emission in Wales. The total CO2 emissions per capita are similar across the Regions.
Table 8.1 Emissions of CO2 by Region
|
Unallocated |
England |
Scotland |
Northern Ireland |
Wales |
|
|
Emissions (ktonnes carbon) |
7,085 |
116,206 |
13,113 |
5,696 |
9,244 |
|
Emissions/Capita (kg/cap) |
2,336 |
2,562 |
3,366 |
3,147 |
It should be noted that these calculations have been made on data in a UN/ECE format which differs slightly from the CO2 emissions data given in Chapter 2.
Figure 8.1 Regional Emissions of CO2 per Capita
Regional Emissions of AQS Pollutants
The emissions of CO are dominated by road transport in all of the regions except for Wales. This is because there are a relatively high number of large point sources located in Wales (as mentioned in Section 8.2). The impact on the emission per capita for the Regions is large. For England, Scotland and Northern Ireland the emissions from road transport account for more than 70% of the CO total. For Wales this contribution is less than 40% and the contribution from point sources is over 50% (compared with 15% for England and considerably less for Scotland and Northern Ireland).
A similar feature is noted with the PM10 emissions, where point sources contribute 75% of the total emission in Wales. Road transport emissions in Wales account for only approximately 10% of the total PM10 emission compared with approx. 25-30% for the other Regions.
Road transport accounts for some 85-90% of the total 1,3-butadiene emission for all of the regions except Scotland (where the contribution is only 70%). This is because there are a number of significant 1,3-butaidene point sources in Scotland associated with the petroleum industry (see also VOC emissions in Section 8.4). However, the emissions per capita are broadly similar, as is also the case for benzene.
Table 8.2 Emissions of AQS Pollutants by Region
|
Unallocated |
England |
Scotland |
Northern Ireland |
Wales |
|
|
1,3-Butadiene |
|||||
|
Emissions (tonnes) |
73 |
4974 |
621 |
201 |
301 |
|
Emissions/Capita (g/cap) |
100 |
121 |
119 |
102 |
|
|
Benzene |
|||||
|
Emissions (tonnes) |
277 |
24079 |
2656 |
945 |
1732 |
|
Emissions/Capita (g/cap) |
484 |
519 |
558 |
590 |
|
|
Carbon Monoxide |
|||||
|
Emissions (ktonnes) |
51 |
3745 |
383 |
137 |
444 |
|
Emissions/Capita (kg/cap) |
75 |
75 |
81 |
151 |
|
|
PM10 |
|||||
|
Emissions (tonnes carbon) |
8330 |
142655 |
20149 |
7283 |
26483 |
|
Emissions/Capita (kg/cap) |
2.9 |
4.0 |
4.3 |
9.0 |
Figure 8.2 Regional Emissions of NAQS Pollutants 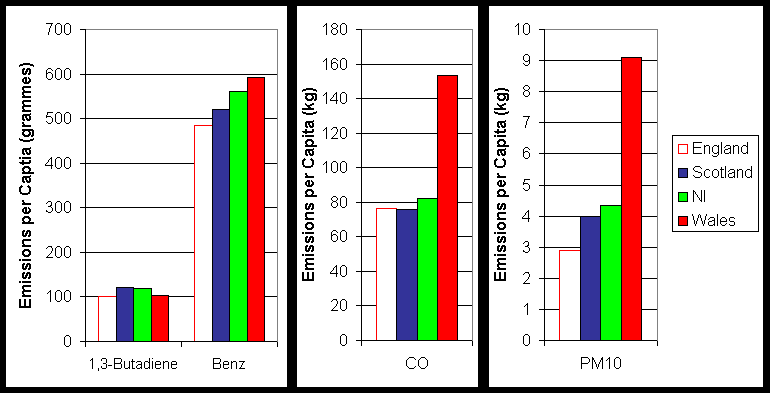
Regional Emissions of Acidifying Pollutants and Ozone Precursors
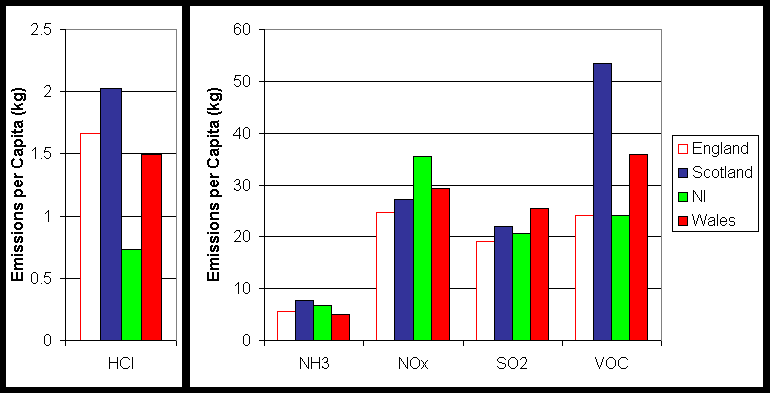
For NOx, the relative contribution from source sectors to the regional total is generally comparable for all Regions. This suggests that the differences in source activity highlighted with other pollutants are not particularly significant for NOx emissions. NOx emissions from road transport account for approximately 45% of the total NOx emissions for all Regions and approximately 35-40% are from point sources.
SO2 emissions in the UK are dominated by point source emissions, but there are relatively few significant point sources in Northern Ireland. Consequently the contribution to the SO2 total for Northern Ireland is significantly lower than the other Regions (60% compared with 85-95%). However, there is a substantial amount of solid fuel used for domestic heating in Northern Ireland and this is reflected in the emissions from the domestic sector, where the contribution to the total is approximately 33% in Northern Ireland. Domestic emissions in England and Wales are approximately 5% reflecting the extensive use of gas, and the dominance of the point source emissions. The resulting emissions per capita are broadly similar across the Regions.
The most striking difference between the Regions relating to VOC emissions are concerned with point source emissions. The extensive emissions from the petroleum industry in Scotland give rise to point sources accounting for 45% of the VOC emissions total, and a considerably larger emission per capita. The emission per capita for Wales is also larger than that for England or Northern Ireland for the same reason.
NH3 emissions are dominated by the agricultural sector, and the percentage contribution to the individual regional totals varies by only a small amount across the different Regions, being approximately 80 – 85 % of the NH3 total.
As HCl emissions arise almost exclusively from coal combustion, the majority of emissions arise from point sources (with some emissions from other industrial combustion). However in Northern Ireland, as previously highlighted, there are relatively few point sources, and consequently the emissions per capita are smaller than the other Regions.
Table 8.3 Emissions of Acidifying Pollutants and O3 Precursors by Region
|
Unallocated |
England |
Scotland |
Northern Ireland |
Wales |
|
|
HCl |
|||||
|
Emissions (ktonnes) |
0 |
82.3 |
10.2 |
1.2 |
4.4 |
|
Emissions/Capita (kg/cap) |
1.7 |
2.0 |
0.7 |
1.5 |
|
|
NH3 |
|||||
|
Emissions (ktonnes) |
0.5 |
282.4 |
39.1 |
11.6 |
14.5 |
|
Emissions/Capita (kg/cap) |
5.7 |
7.6 |
6.8 |
4.9 |
|
|
NOx |
|||||
|
Emissions (ktonnes) |
121.8 |
1203.4 |
136.4 |
58.9 |
84.4 |
|
Emissions/Capita (kg/cap) |
24.1 |
26.7 |
34.9 |
28.9 |
|
|
SO2 |
|||||
|
Emissions (ktonnes) |
41.0 |
928.1 |
110.4 |
34.2 |
73.3 |
|
Emissions/Capita (kg/cap) |
18.7 |
21.5 |
20.1 |
24.9 |
|
|
VOC |
|||||
|
Emissions (ktonnes) |
98.5 |
1217.9 |
278.3 |
41.6 |
107.7 |
|
Emissions/Capita (kg/cap) |
24.5 |
54.3 |
24.5 |
36.5 |
Figure 8.3 Regional Emissions of Acidifying Pollutants and Ozone Precursors
Regional Emissions of Persistent Organic Pollutants
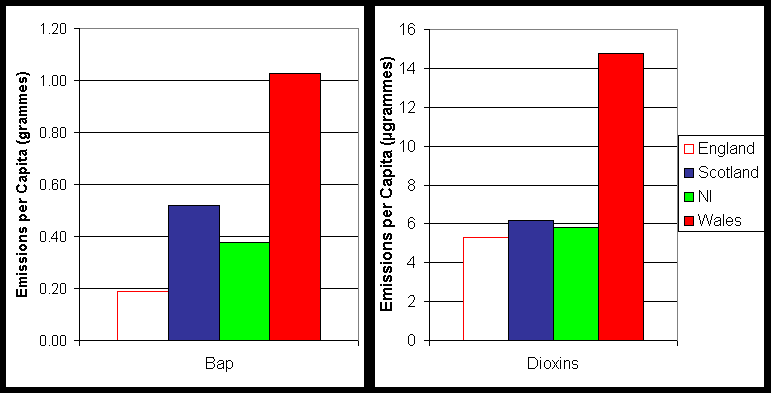
Emissions of BaP arise from a variety of sources. In Wales the emissions are dominated by industrial point sources (accounting for over 75% of the Wales total), which account for the higher emissions per capita. Similar observations may be made on the Dioxin emissions where point sources and the domestic sector are the most important source sectors.
Table 8.4 Emissions of POPs by Region
|
Unallocated |
England |
Scotland |
Northern Ireland |
Wales |
|
|
BaP |
|||||
|
Emissions (tonnes) |
0.1 |
9.3 |
2.7 |
0.6 |
3.1 |
|
Emissions/Capita (g/cap) |
0.19 |
0.52 |
0.38 |
1.03 |
|
|
Dioxins |
|||||
|
Emissions (grammes) |
1 |
260 |
32 |
10 |
43 |
|
Emissions/Capita ( mg/cap) |
5.2 |
6.1 |
5.7 |
14.7 |
Figure 8.4 Regional Emissions of Persistent Organic Pollutants
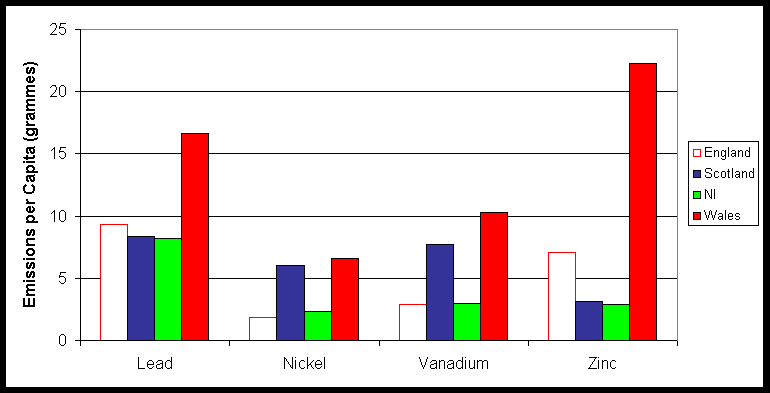
Regional Emissions of Heavy Metals
The most important source sectors for heavy metal emissions depends on the metal. For some, solid fuel combustion in power generation, industry and the domestic sector are important and trends may be observed as explained in previous sectors.
Emissions per capita of Chromium and Copper are noted to be particularly high in Wales. This is due to the relatively large amount of heavy industry located in the Region.
Emissions of Vanadium are dominated by liquid fuel combustion (although emissions from motor spirit are small), and hence emissions primarily arise from point sources found in Wales and Scotland.
Emissions of Lead primarily arise from road transport with percentage contributions to the Regional totals of 60 – 75% for England, Scotland and Northern Ireland. However, production processes account for some 50% of the emission from Wales and this gives rise to the relatively high emission per capita. A similar explanation can be given for the zinc emissions.
Table 8.5 Emissions of Heavy Metals by Region
|
Unallocated |
England |
Scotland |
Northern Ireland |
Wales |
|
|
As |
|||||
|
Emissions (tonnes) |
0.2 |
38.2 |
4.5 |
1.6 |
2.3 |
|
Emissions/Capita (g/cap) |
0.77 |
0.89 |
0.95 |
0.78 |
|
|
Cd |
|||||
|
Emissions (tonnes) |
0.0 |
5.4 |
0.4 |
0.1 |
0.6 |
|
Emissions/Capita (g/cap) |
0.11 |
0.08 |
0.07 |
0.20 |
|
|
Cr |
|||||
|
Emissions (tonnes) |
0.0 |
55.6 |
3.2 |
0.9 |
7.0 |
|
Emissions/Capita (g/cap) |
1.12 |
0.62 |
0.51 |
2.34 |
|
|
Cu |
|||||
|
Emissions (tonnes) |
0.3 |
46.4 |
3.9 |
0.9 |
7.5 |
|
Emissions/Capita (g/cap) |
0.94 |
0.75 |
0.52 |
2.56 |
|
|
Hg |
|||||
|
Emissions (tonnes) |
0.0 |
7.3 |
0.6 |
0.2 |
0.4 |
|
Emissions/Capita (g/cap) |
0.15 |
0.12 |
0.11 |
0.14 |
|
|
Ni |
|||||
|
Emissions (tonnes) |
1.7 |
91.5 |
30.9 |
4.0 |
19.3 |
|
Emissions/Capita (g/cap) |
1.84 |
6.02 |
2.36 |
6.59 |
|
|
Pb |
|||||
|
Emissions (tonnes) |
1.7 |
448.5 |
41.6 |
13.5 |
47.4 |
|
Emissions/Capita (g/cap) |
9.02 |
8.12 |
7.97 |
16.14 |
|
|
Se |
|||||
|
Emissions (tonnes) |
0.1 |
34.1 |
5.6 |
1.3 |
3.2 |
|
Emissions/Capita (g/cap) |
0.69 |
1.09 |
0.78 |
1.06 |
|
|
V |
|||||
|
Emissions (tonnes) |
5.1 |
145.4 |
39.4 |
5.0 |
30.2 |
|
Emissions/Capita (g/cap) |
2.92 |
7.71 |
2.95 |
10.28 |
|
|
Zn |
|||||
|
Emissions (tonnes) |
1.3 |
354.0 |
16.1 |
4.9 |
65.8 |
|
Emissions/Capita (g/cap) |
7.12 |
3.14 |
2.90 |
22.39 |
Figure 8.5a Regional Emissions of Heavy Metals
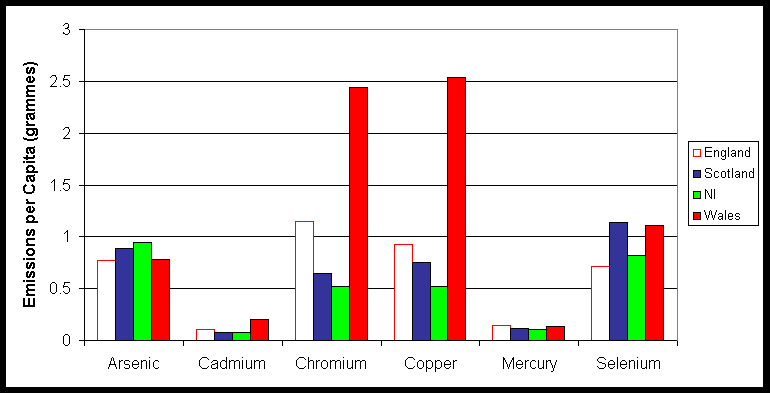
Figure 8.5b Regional Emissions of Heavy Metals
UK Territories and Dependencies
Work is currently being conducted to estimate emissions of various pollutants from a number of UK dependencies, territories and sovereign bases. This is required as there are international protocols which specify that the emissions arising from these locations are to be included in the UK emissions totals.
At present information is available for some of these locations. However, the emissions inventories for all of these locations will be presented when the work has been completed in full.