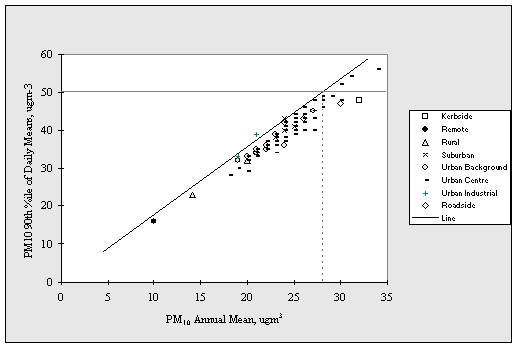
Figure 1: PM10 90th percentile of daily means vs PM10 annual mean. Data derived from UK Automatic Network sites 1992-97. (µg/m3, TEOM)
 Notes
Notes
A worst case ‘best fit’ line has been applied, equivalent to the 95th percentile of the measured ratios. This gives the following relationship;
PM10 90th percentile of daily means = 1.79 PM10 annual mean
This compares to the regression analysis which gives the relationship;
y = 1.68x, R2= 0.87
Report prepared by Stanger Science and Environment
Site prepared by the National Environmental Technology Centre, part of AEA Technology, on behalf of the UK Department of the Environment, Transport and the Regions